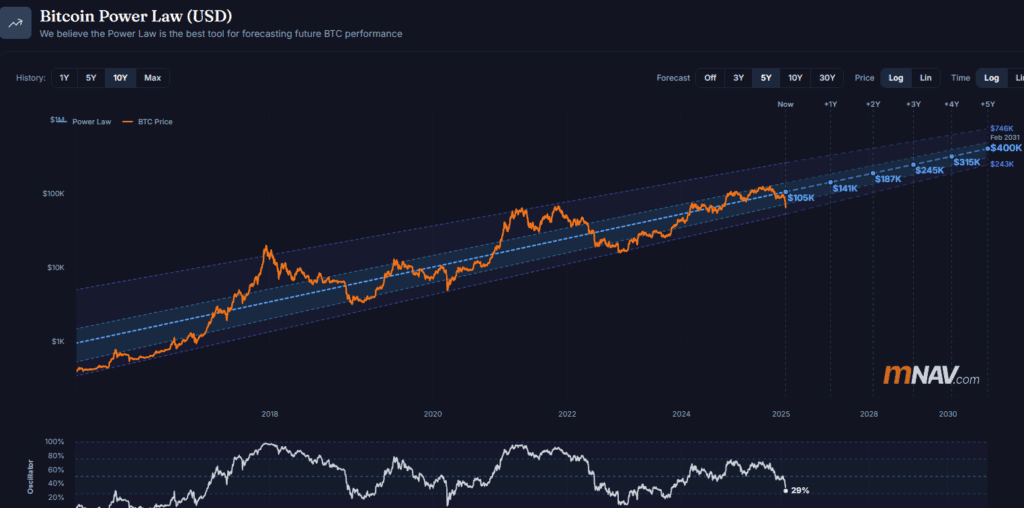
Long-term price model: The Power Law charts Bitcoin’s price over time on a log-log scale, showing a consistent mathematical relationship between time and price rather than random movement.
Trend line with bounds: It plots a regression line and upper/lower bands representing historical price support and resistance relative to that long-term trend.
Interpretation: The model suggests price milestones like support levels and long-term targets (e.g., ≥$100,000 by a certain year), assuming past patterns continue.
Not a guaranteed forecast: The Power Law reflects historical structure, but external shocks or economic changes may cause deviations — it’s not financial advice or a strict prediction.
Used for structural insight: This model helps illustrate Bitcoin’s long-term growth behavior across cycles, and is often used with other data rather than on its own for trading decisions.


Leave a Comment