Kategorie: Indicator
Bitcoin indicators analyze on-chain and market data to identify trends, signals and network conditions.
They are commonly used for research, trading and long-term analysis.
-
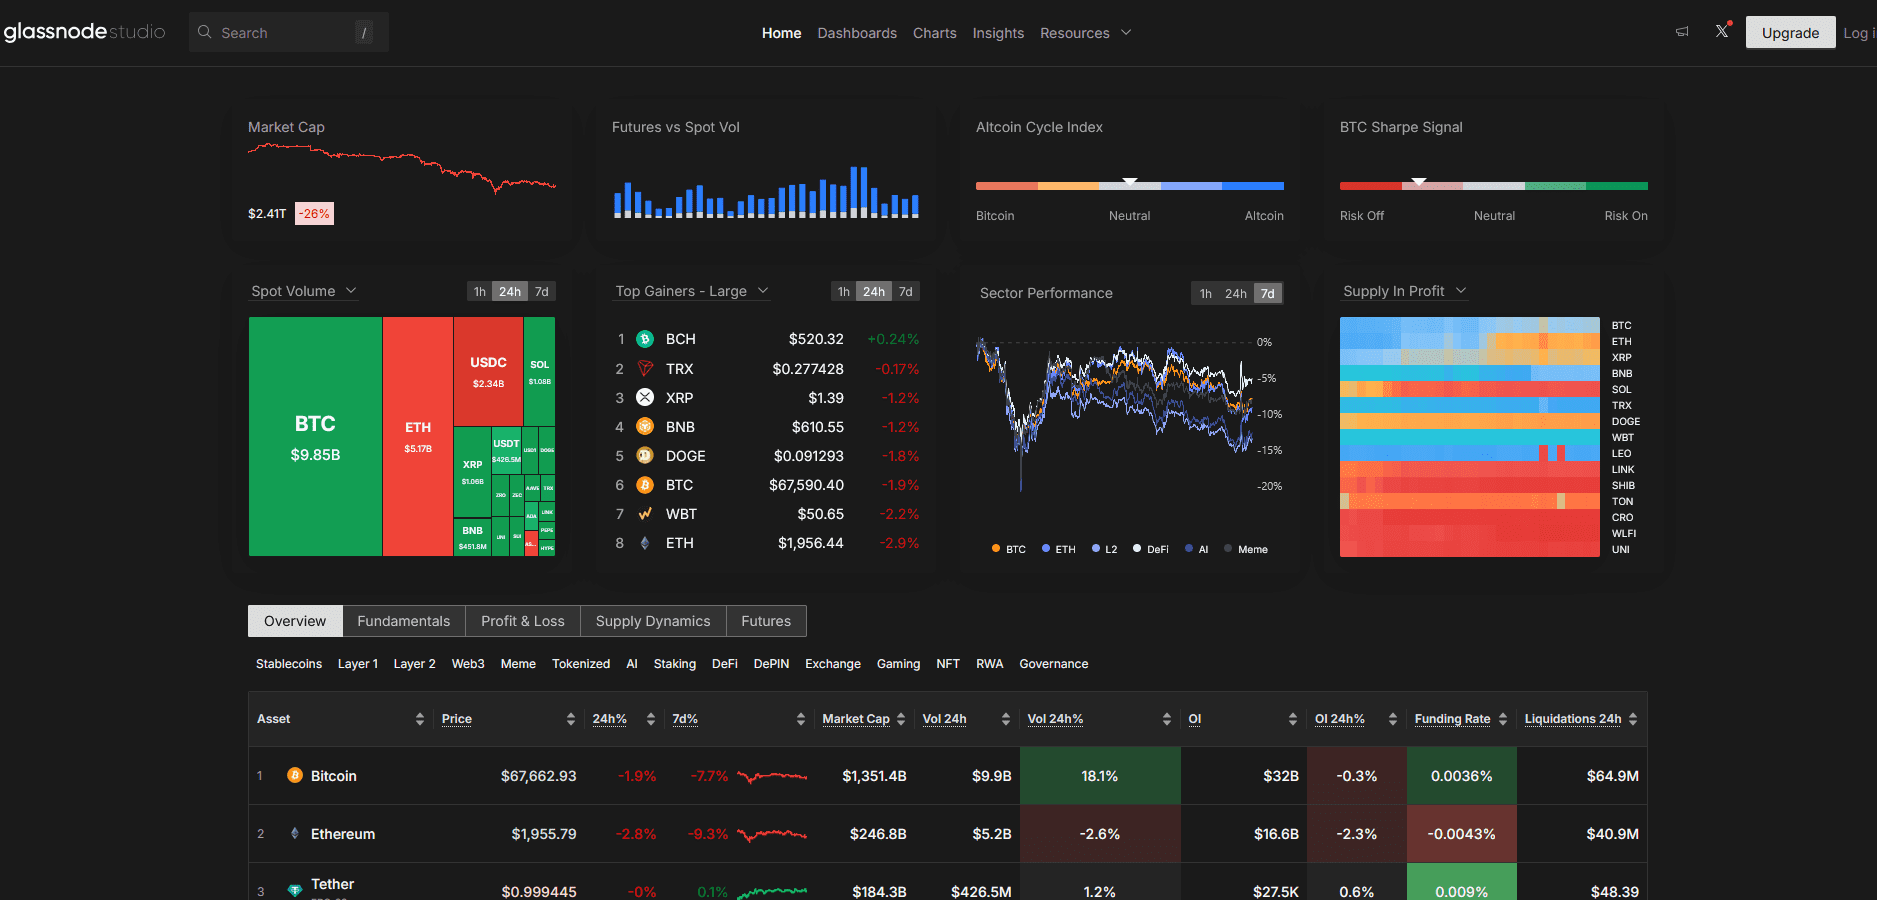
Glassnode
0 (0)Read more: GlassnodeShows a comprehensive overview of Bitcoin on-chain and market metrics for BTC. Includes key indicators like address activity, supply, transaction metrics, and price trends (on-chain fundamentals vs market data). Visualizes…
0 (0) -

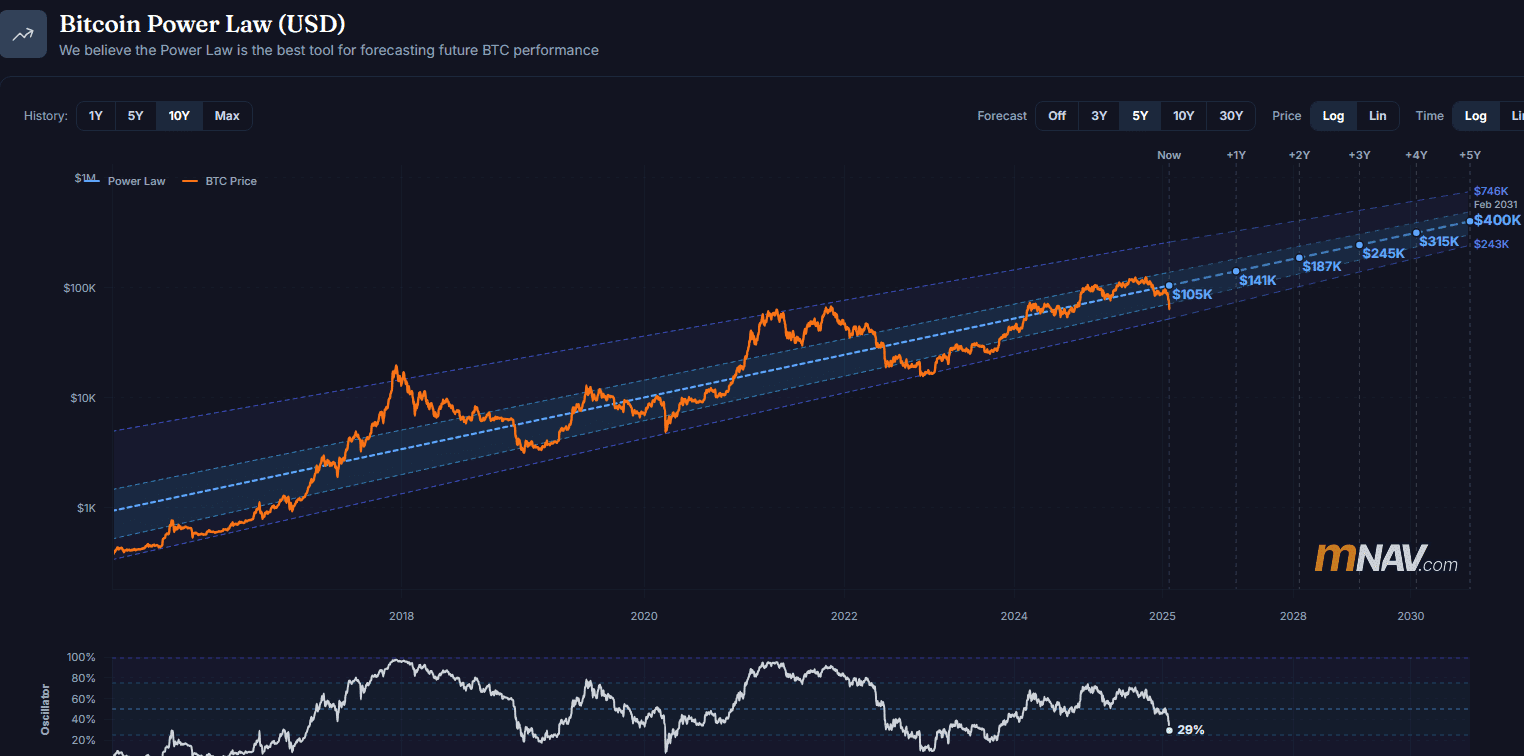
mnav.com – Bitcoin Power Law
0 (0)Read more: mnav.com – Bitcoin Power LawLong-term price model: The Power Law charts Bitcoin’s price over time on a log-log scale, showing a consistent mathematical relationship between time and price rather than random movement. Trend line…
0 (0) -
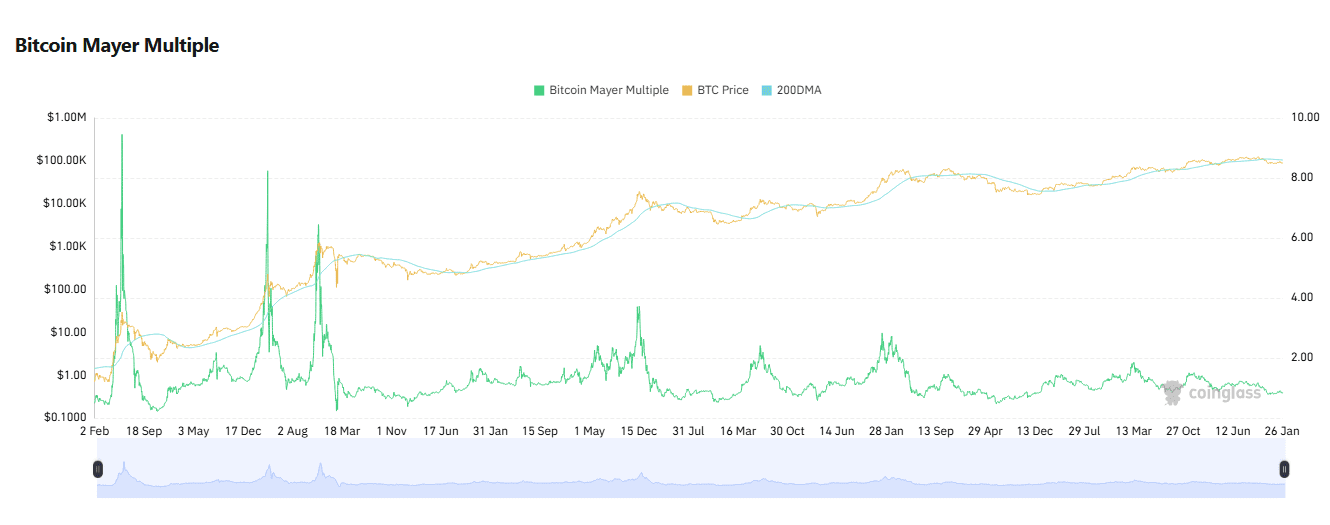
Meyer Multiplier
0 (0)Read more: Meyer MultiplierBitcoin Meyer MultiplierThe Bitcoin Meyer Multiplier is a valuation indicator that shows whether Bitcoin is over- or undervalued relative to its long-term trend. Definition:Meyer Multiplier=Current Bitcoin Price200-Day Average\text{Meyer Multiplier} = \frac{\text{Current Bitcoin Price}}{\text{200-Day Average}}Meyer Multiplier=200-Day AverageCurrent Bitcoin Price…
0 (0) -
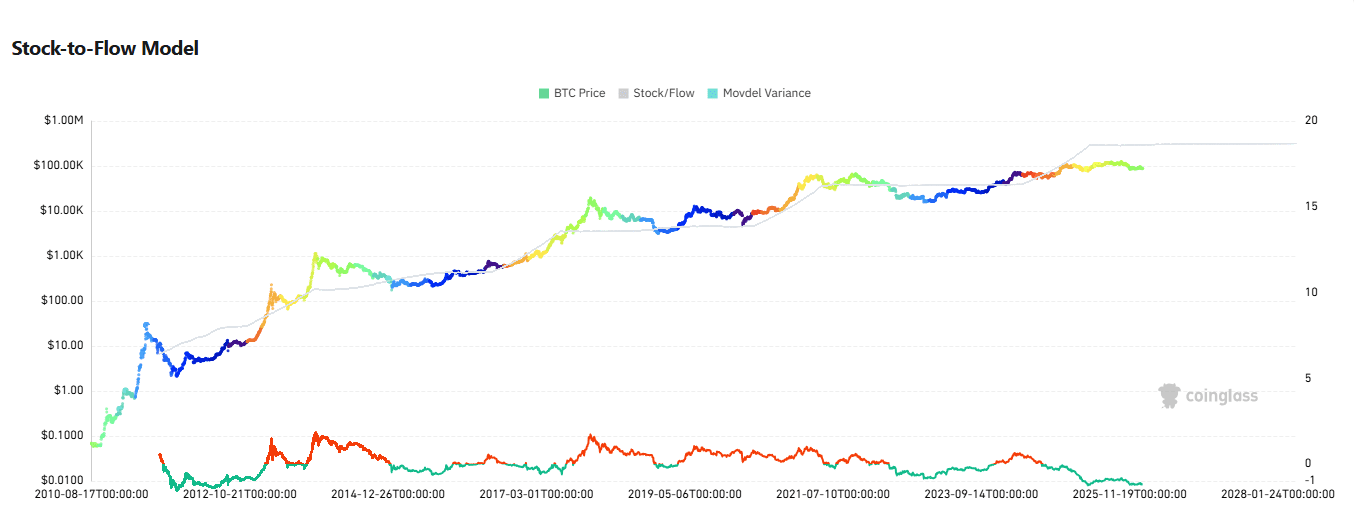
Stock to flow
0 (0)Read more: Stock to flowStock-to-Flow Model (S2F)The Stock-to-Flow model describes the scarcity of an asset by comparing the existing stock to the annual production flow. For Bitcoin: Formula:Stock-to-Flow=StockAnnual Production\text{Stock-to-Flow} = \frac{\text{Stock}}{\text{Annual Production}}Stock-to-Flow=Annual ProductionStock Core Idea:The higher…
0 (0)